3.1) Plotting
Plotting in IDL is quite straightforward. We will start by plotting a simple line plot using 2 arrays of data. Insert the following code into a file called simple_plot.pro.
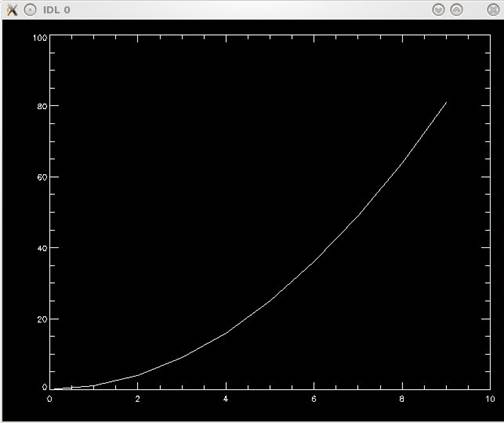
x = findgen(10)
x2 = x^2
plot, x, x2
END
Notice that we created the x array using "findgen(10)", this creates a 10 element floating point array with the value of each element set equal to it's array index (i.e. 0 to 9).
Save the file and run the program in IDL. A window should appear which looks like that show below: