3.4) Multiple Line Plots
It is easy to overlay another set of data on an existing plot using the "oplot" procedure. Create a second set of numbers to plot and add that data to the last plot. Insert the following code into simple_plot.pro after the "plot, x, x2" line.
x3 = x^3
oplot, x, x3
Save the file and run the program. You should now see a plot similar to that below:
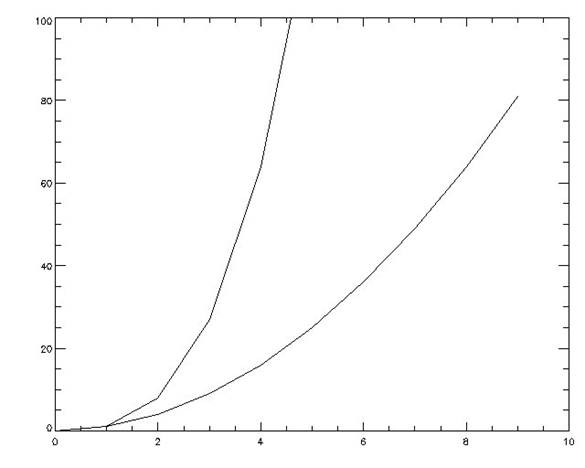
You can see that the new data is added to the plot. However, this isn't that useful as a plot as you can't tell which line is which. We have a number of options to make the two lines distinct. We can plot the lines in different colours, use different line styles or even different plotting symbols.