5.11) Example Procedure (cont'd)
The best way to exclude bad data is to use a WHERE statement to get the array indices of the good data.
good_data = where(data(3,*) ne 9999999 and data(2,*) ne 9999999)
; Determine where the data is good
Now we know where the good data is and we can use this information to make a better plot.
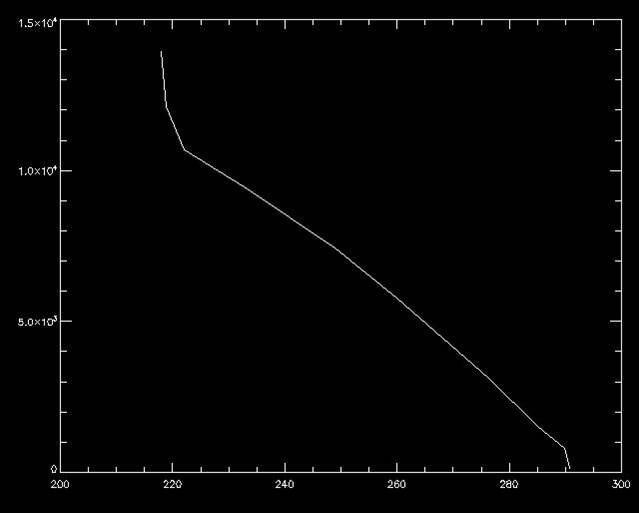
plot, data(3, good_data), data(2, good_data)
; Plot the data
You plot should now look like the plot below.