5.10) Example Procedure (cont'd)
We can now test the code by reading a file. The file larkhill_200506241022.txt contains radiosonde data for Larkhill. If we open this file in a text editor we can see that it has 5 header lines and 7 columns of data. We can therefore use our reading code to read the data from this by typing the following at the IDL command line:
read_ascii_cols, 'larkhill_200506241022.txt', data, header, 7, head_length=5
; Read in the data file
If you print the last line of the header "print, header(4)", you can see what the different columns of data are. Now try plotting the temperature (column 4) against the height (column 3), remember IDL counts from zero.
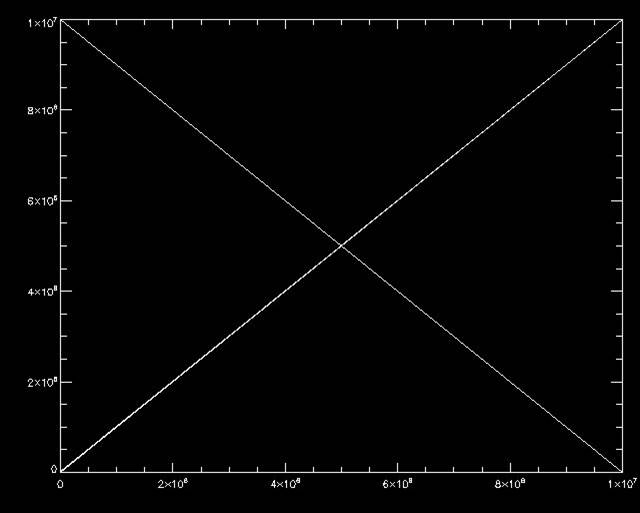
plot, data(3,*), data(2,*)
You will get a not very useful plot which looks like the plot below. This is because the data contains lots of bad data values (9999999s), and we need to exclude them.