7.2) Contour Plots (cont'd)
In the previous example we just called "contour" to contour our data and allowed IDL to decide for itself which contour levels to use. Generally we want to pick these ourselves, we can do this by setting the "levels" keyword in the call to contour, to an array containing the values for the levels we want to use:
levs=indgen(25)*2./1000.
contour, q(*,*,20,0), lon, lat, xrange=[-30,40], yrange=[0,40], xstyle=1, levels=levs
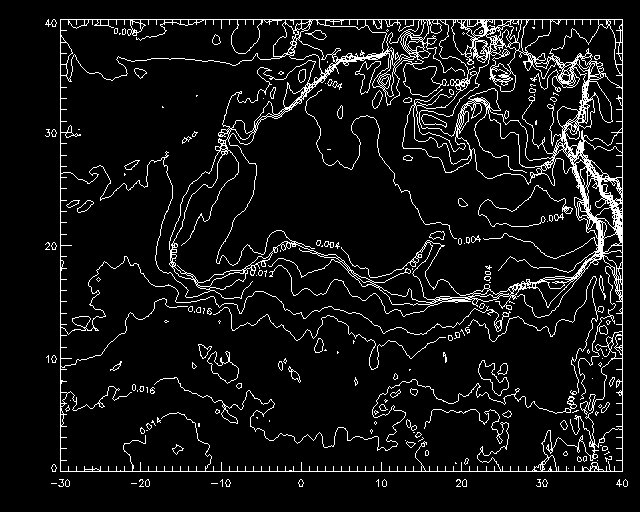
We can also label the contours, to do this we set the "c_labels" keyword equal to an array of the same size as our levels array, in which we set each of the elements to either 1 (label this level) or 0 (don't label). So if we want to label every contour in the previous example, we use:
labels=intarr(25)+1
contour, q(*,*,20,0), lon, lat, xrange=[-30,40], yrange=[0,40], xstyle=1, levels=levs, c_labels=labels