7.6) Colour Contour Plots
If you want to make your plot look more colourful, then simply load a colour table before doing the contouring:
loadct, 39
map_set, /mercator, limit=[0,-30,40,40], position=[0.15,0.15,0.9,0.8]
contour, q(*,*,20,0), lon, lat, levels=levs, c_labels=labels, /fill, /overplot
map_continents
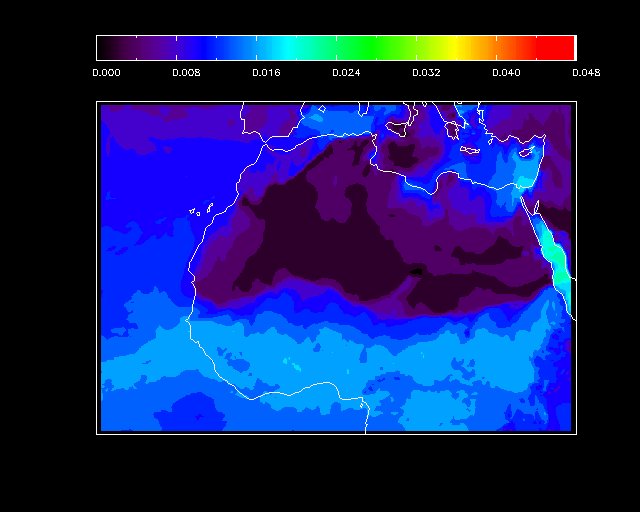
colorbar, range=[min(levs),max(levs)], position=[0.15,0.88,0.9,0.93], format='(f9.3)', title="Water vmr"
This will produce the plot below: