University links
University links
For staff
For Staff
Services A-Z
Student Education Service
For students
Minerva
Mobile app
For Students
Faculties
Faculty of Arts, Humanities and Cultures
Faculty of Biological Sciences
Faculty of Business
Faculty of Engineering and Physical Sciences
Faculty of Environment
Faculty of Medicine and Health
Faculty of Social Sciences
Lifelong Learning Centre
Language Centre
Other
Staff A-Z
Campus map
Jobs
Alumni
Contacts
Library
IT
VideoLeeds
Leeds University Union
Follow us
Facebook
Twitter
YouTube
LinkedIn
Instagram
Medium
Weibo
The Conversation
RSS news feed
Close quicklinks
Search
Destination
Software Programming And Modelling For Scientific Researchers site
All University of Leeds content
Search
Software Programming And Modelling For Scientific Researchers
Menu
Close
Home
About
Courses
C++
Fortran
High Performance Computing
IDL
MATLAB
Modelling and Simulation
NetLogo
Python
R
Unix
Vensim
Home
MATLAB
1) Typical Uses
1.2) Data Processing
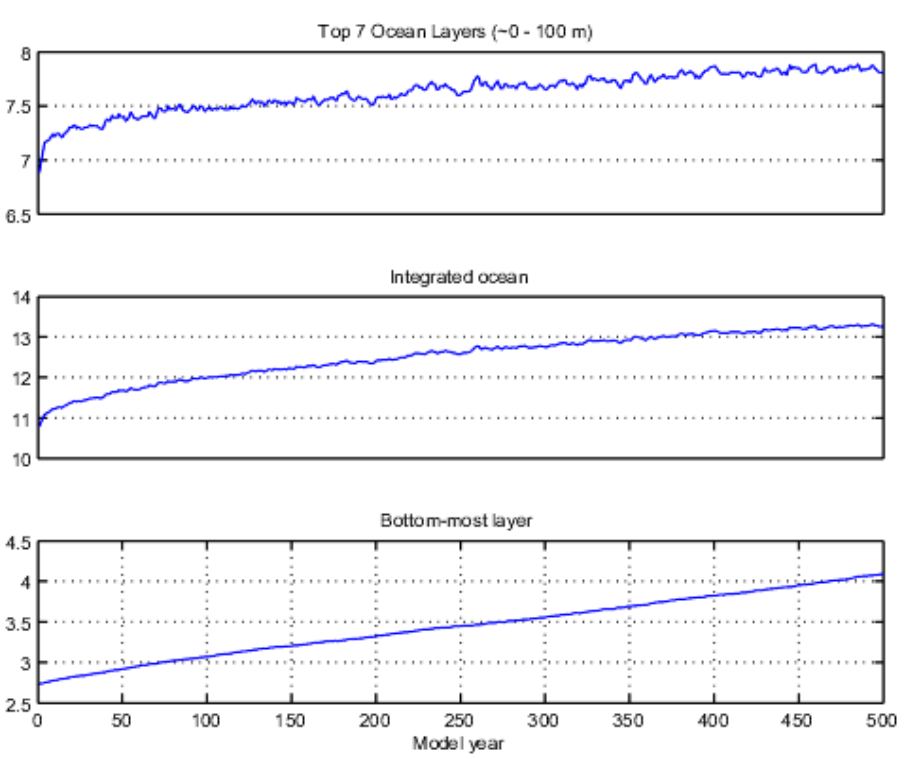
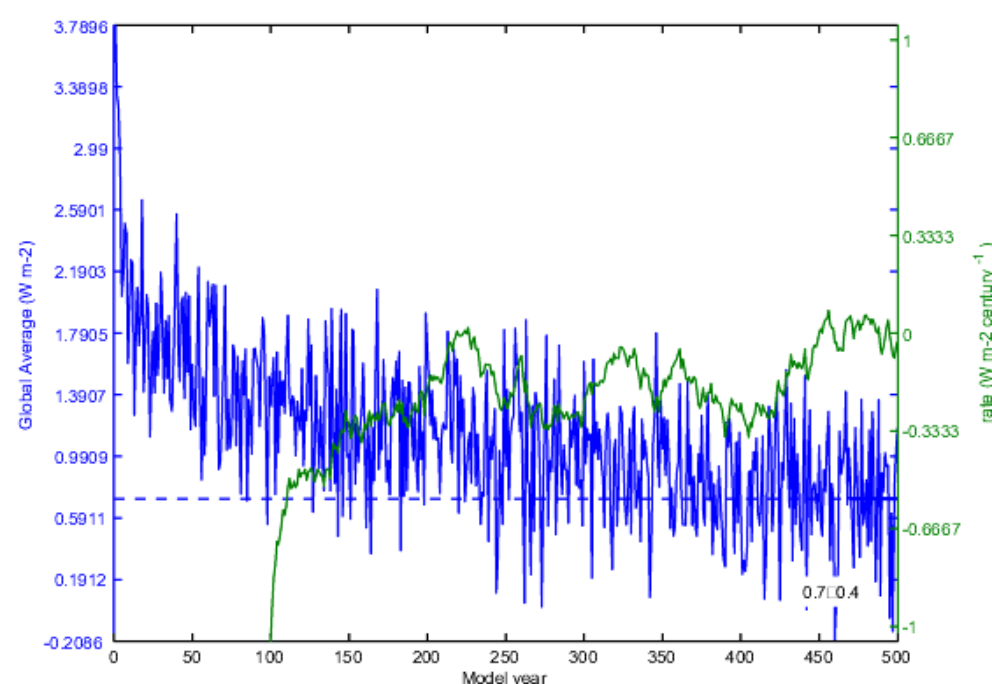
(Above) Line plots resulting from an evaluation of the equilibrium state of a climate model run in terms of radiation budget and ocean temperature.
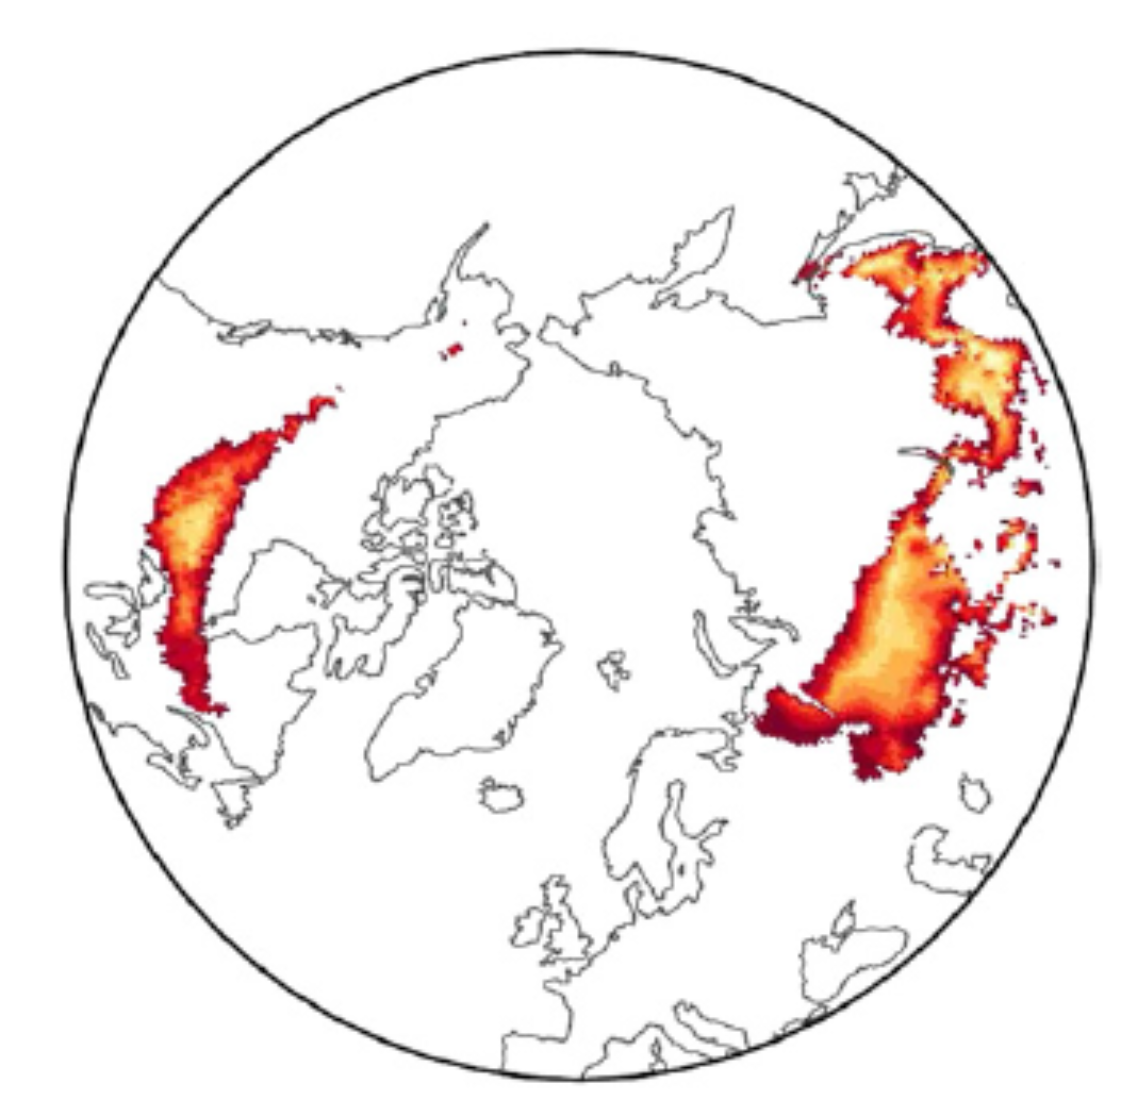
Intensity data overlayed on a projected geographic image.
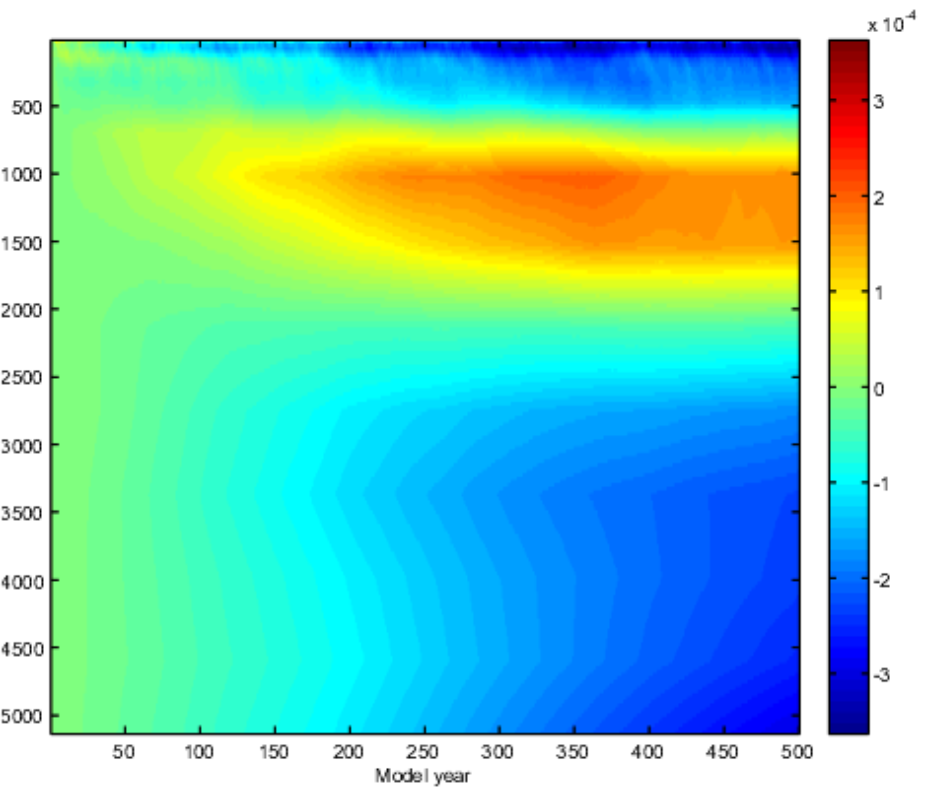
Image type plot of globally-integrated salinity vs. depth from a climate model experiment investigating changing orbital configuration.
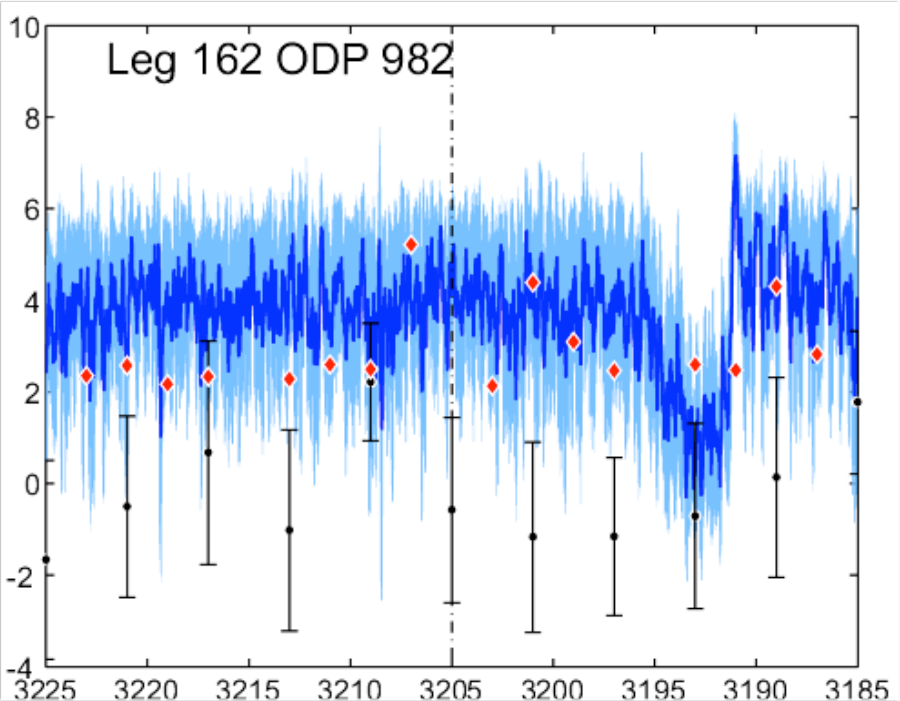
A line and point-wised plot comparing model predicted sea surface temperatures against geological data.
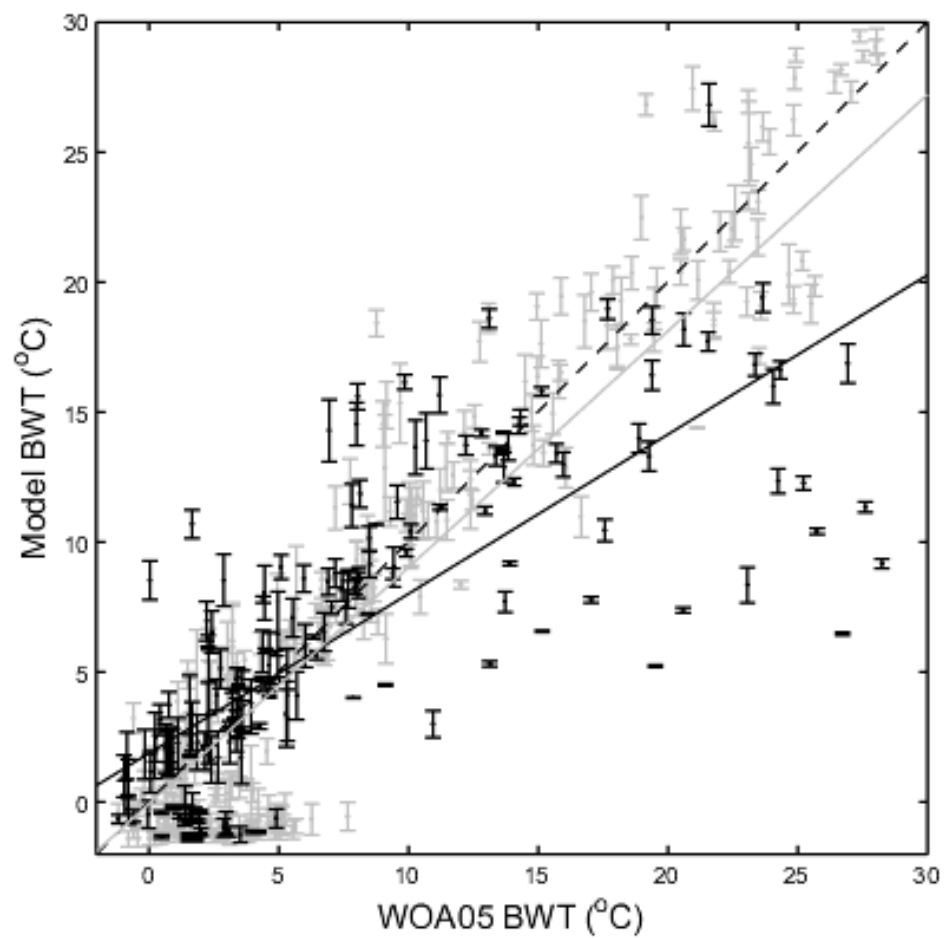
Evaluation of a climate model predicted bottom water temperatures during the period 1950 to 2005 compared against observations.
First Page
Previous Page
Last Page
Next Page