12.1) Plotting
- Matlab offers a wealth of plotting functions to allow you to plot a wide range of data
- If we consider data being in the form of vectors, matrices and multi-dimensional arrays, then these may be visualized using line or scatter plots, images or 3D visualizations
- Let's start with basic plotting involving line plots:
- Let's generate some noisy test data and generate some very basic plots
[matlab]
figure % Creates a new figure window ready for a plot
plot(x, y) % Creates a line plot of vector "x" against vector "y"
plot(x) % Creates a line plot of vector "x" against the vector index (1:length(x))
[/matlab]
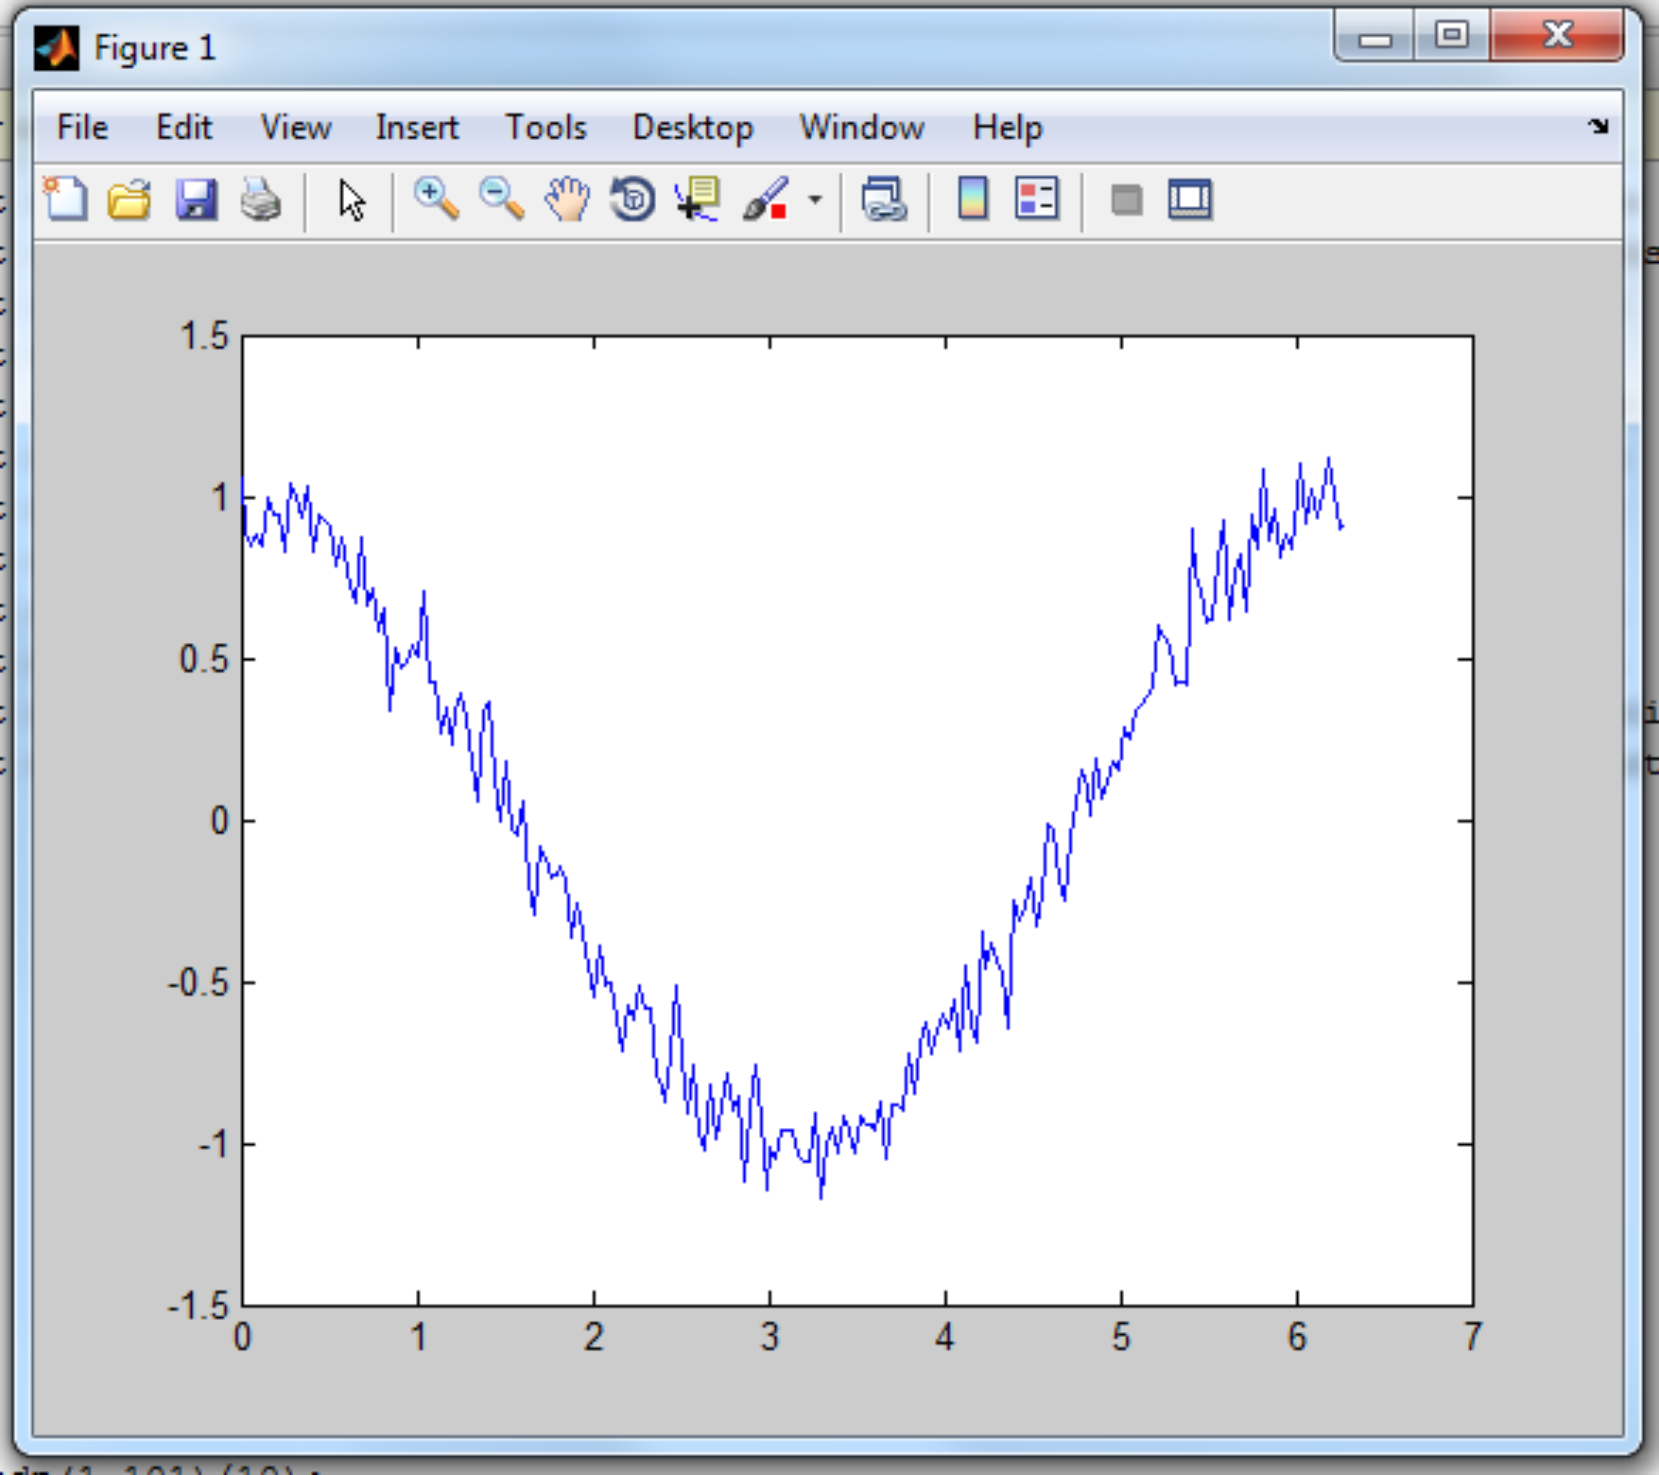
[matlab]
x=[0:pi/100:2*pi];
x_elements=length(x); % find the length of x
% now make a noisy cosine dataset
y=cos(x)+(rand(1, x_elements)/10);
figure % open up a figure
plot(x, y)
[/matlab]