12.2) Colour, Markers and Line Styles
We can change the line style of the plot by adding a third argument to the plot command:
[matlab]
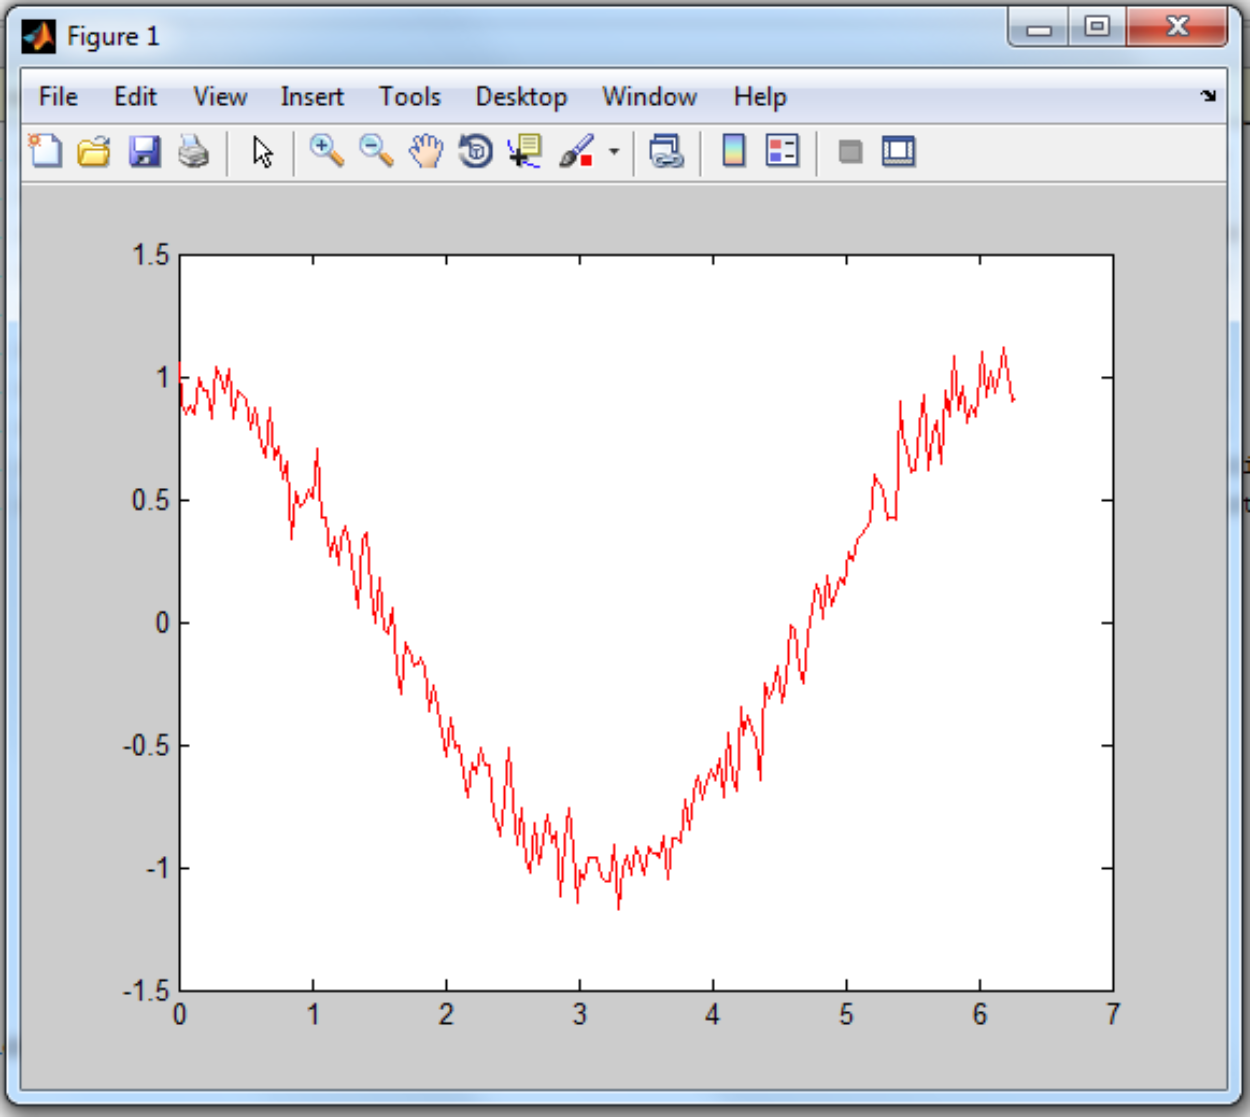
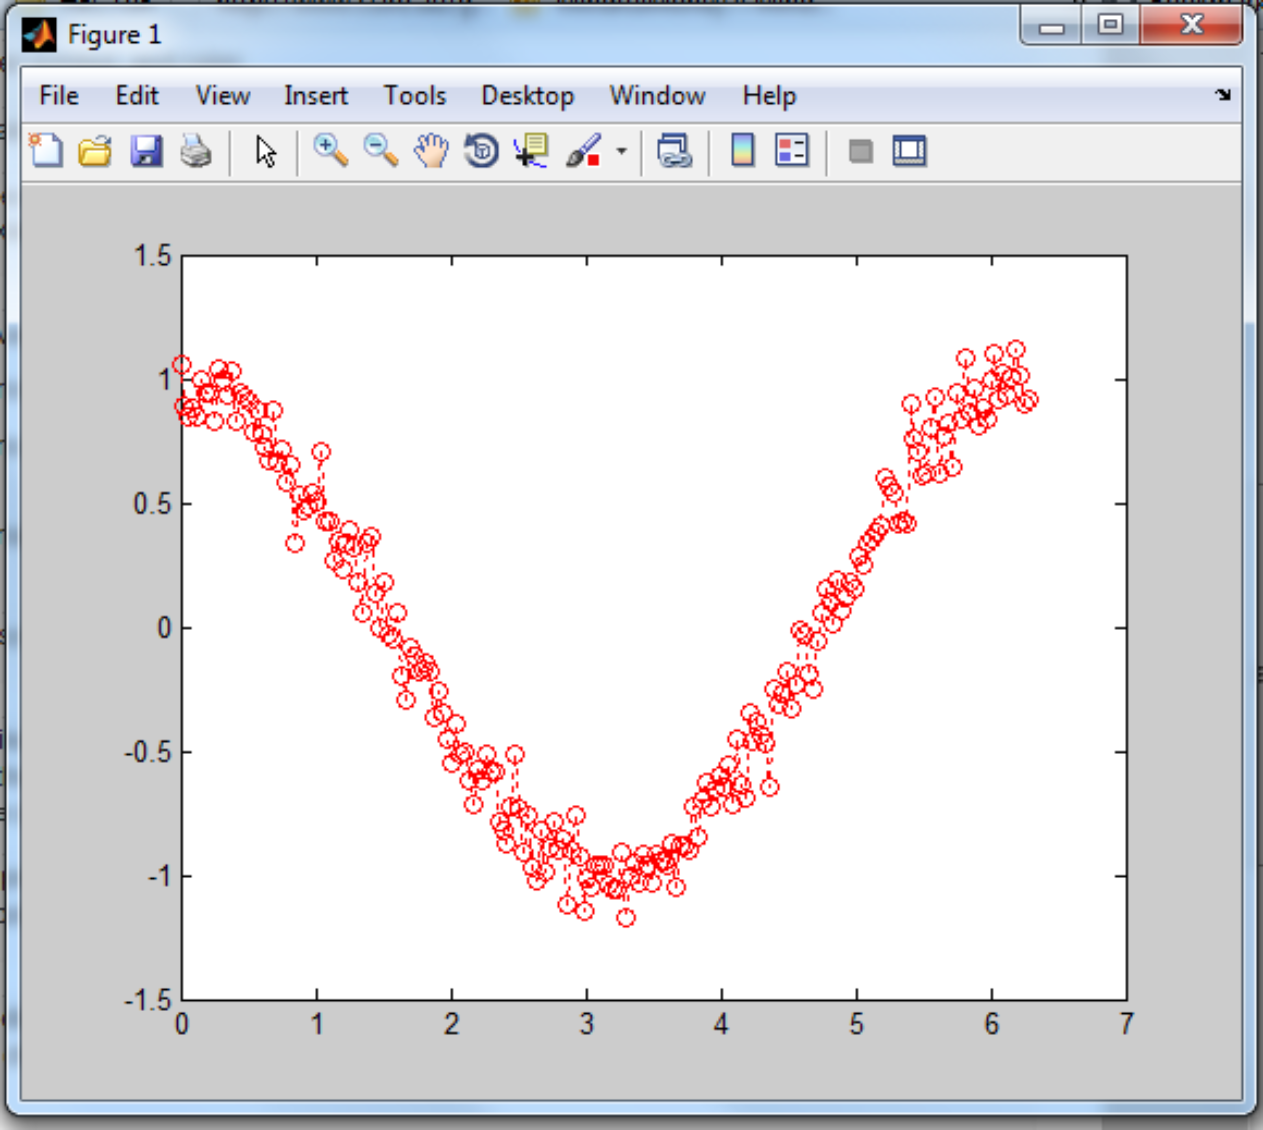
plot(x, y, 'r')
plot(x, y, 'ro:')
[/matlab]
|
 |
The third argument is constructed using elements from the table below:
| Symbol | Colour | Symbol | Marker | Symbol | Line Style |
| b | blue (default) | . | dot | - | soild line (default) |
| g | green | o | circle | : | dotted line |
| r | red | x | cross | -. | dash dor line |
| c | cyan | + | plus | -- | dashed line |
| m | magenta | * | asterisk | ||
| y | yellow | s | square | ||
| k | black | v | down triangle | ||
| w | white | ^ | up triangle | ||
| < | left triangle | ||||
| > | right triangle | ||||
| p | pentagram |