12.3) Multiple Line Plots
Let's generate a second dataset, this time a cosine signal without any noise:
[matlab]
z=cos(x)
plot(x, y, 'r', x, z, 'k')
[/matlab]
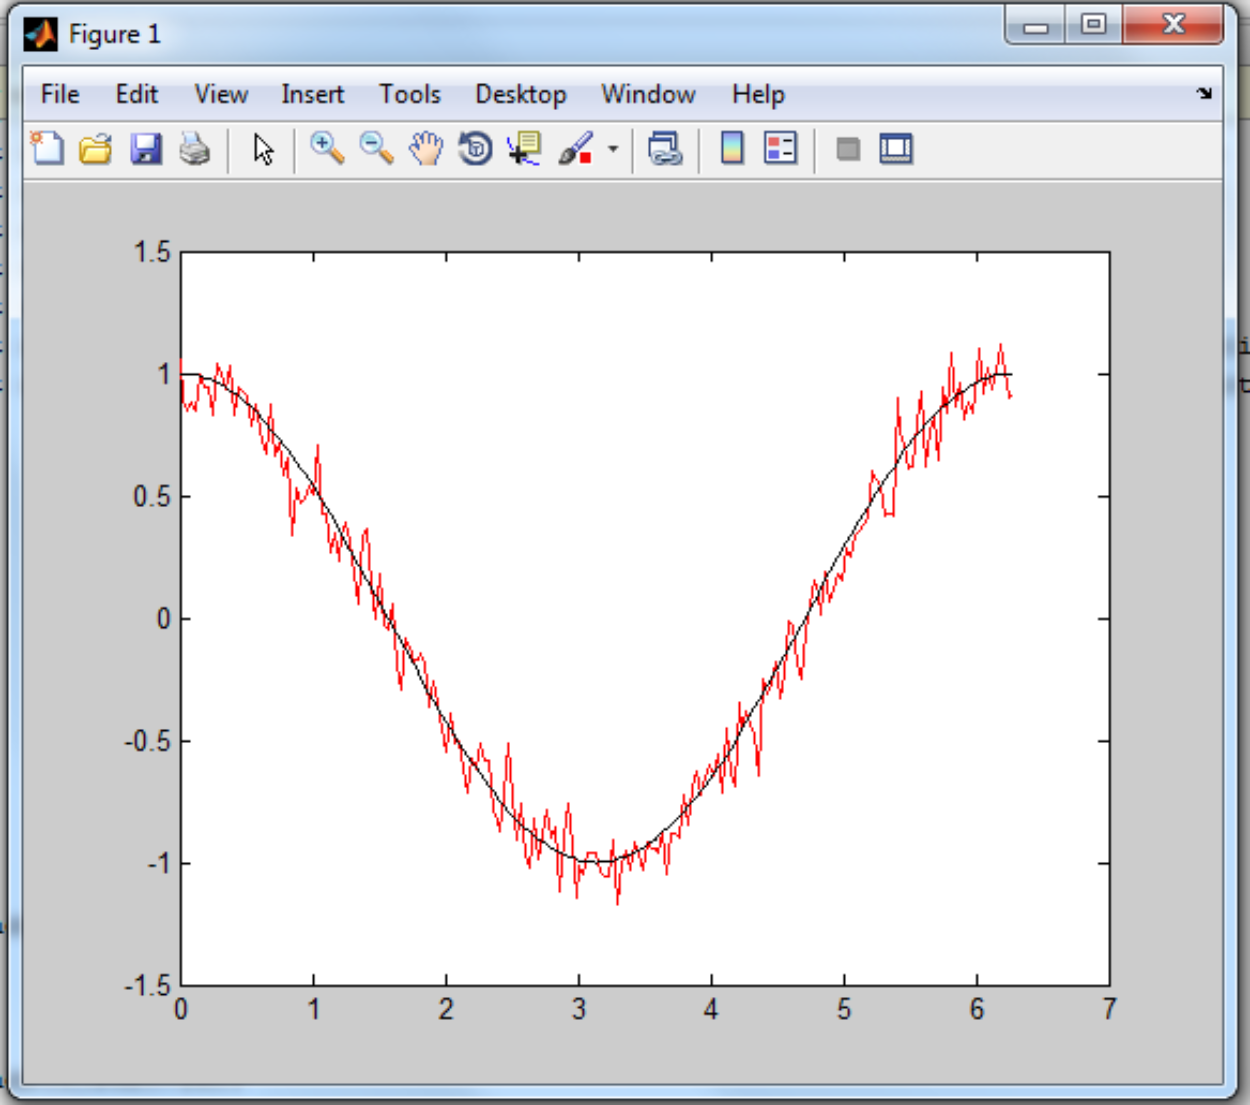
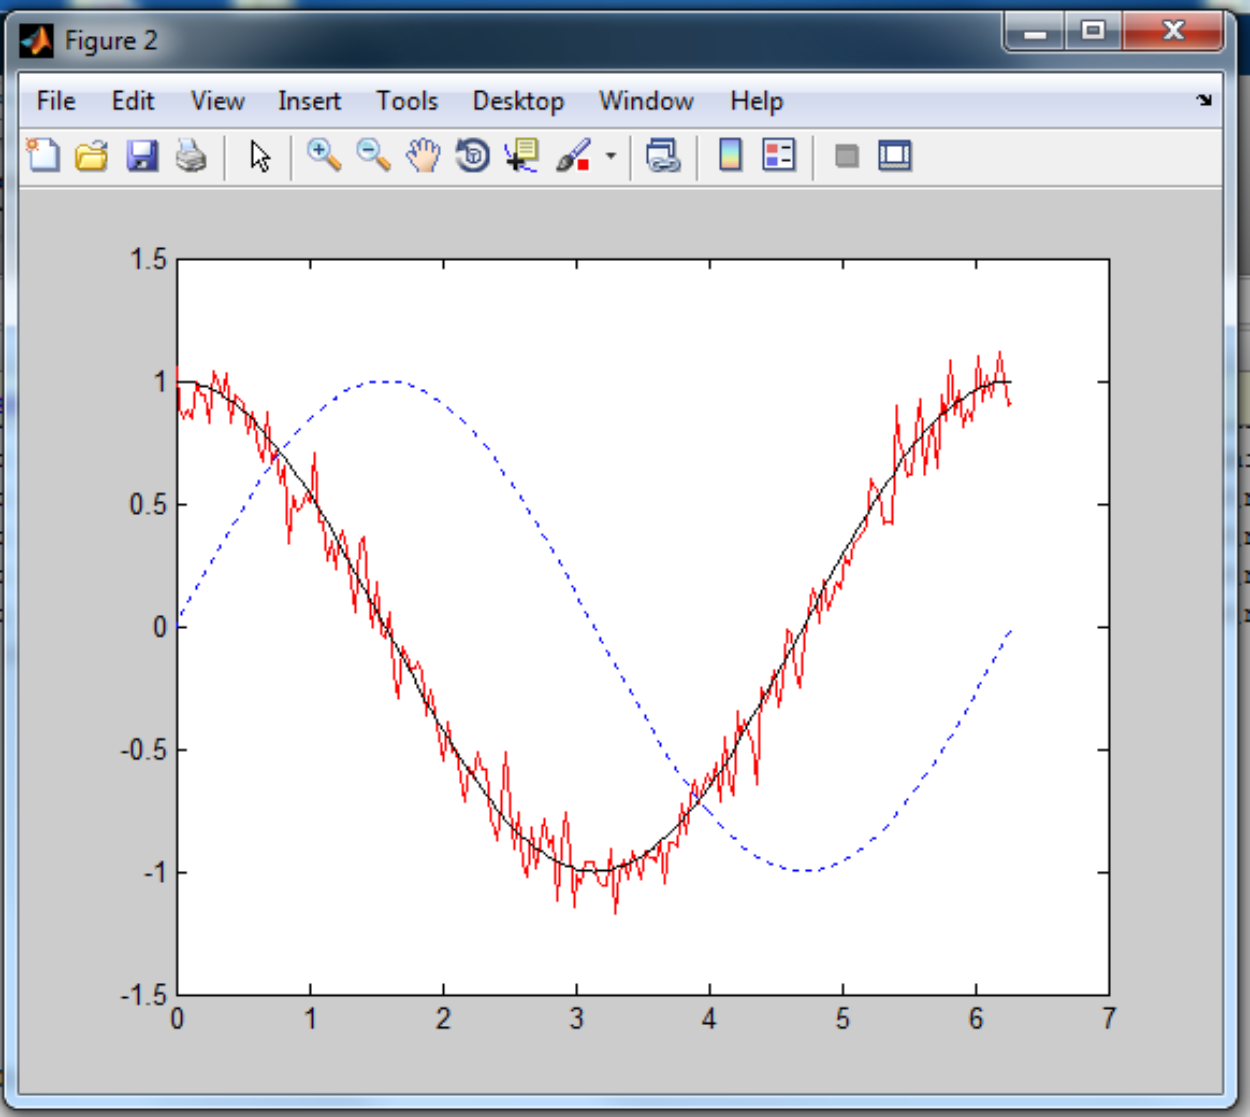
Did you notice that every time we got Matlab to draw another plot, it overwrote the existing plot? Let's add a third dataset, this time using the "hold on" command so that additional plots can be added to the current figure.
[matlab]
figure
a=sin(x)
plot(x, y, 'r', x, z, 'k')
hold on
plot(x, a, ':')
[/matlab]