12.4) Annotations
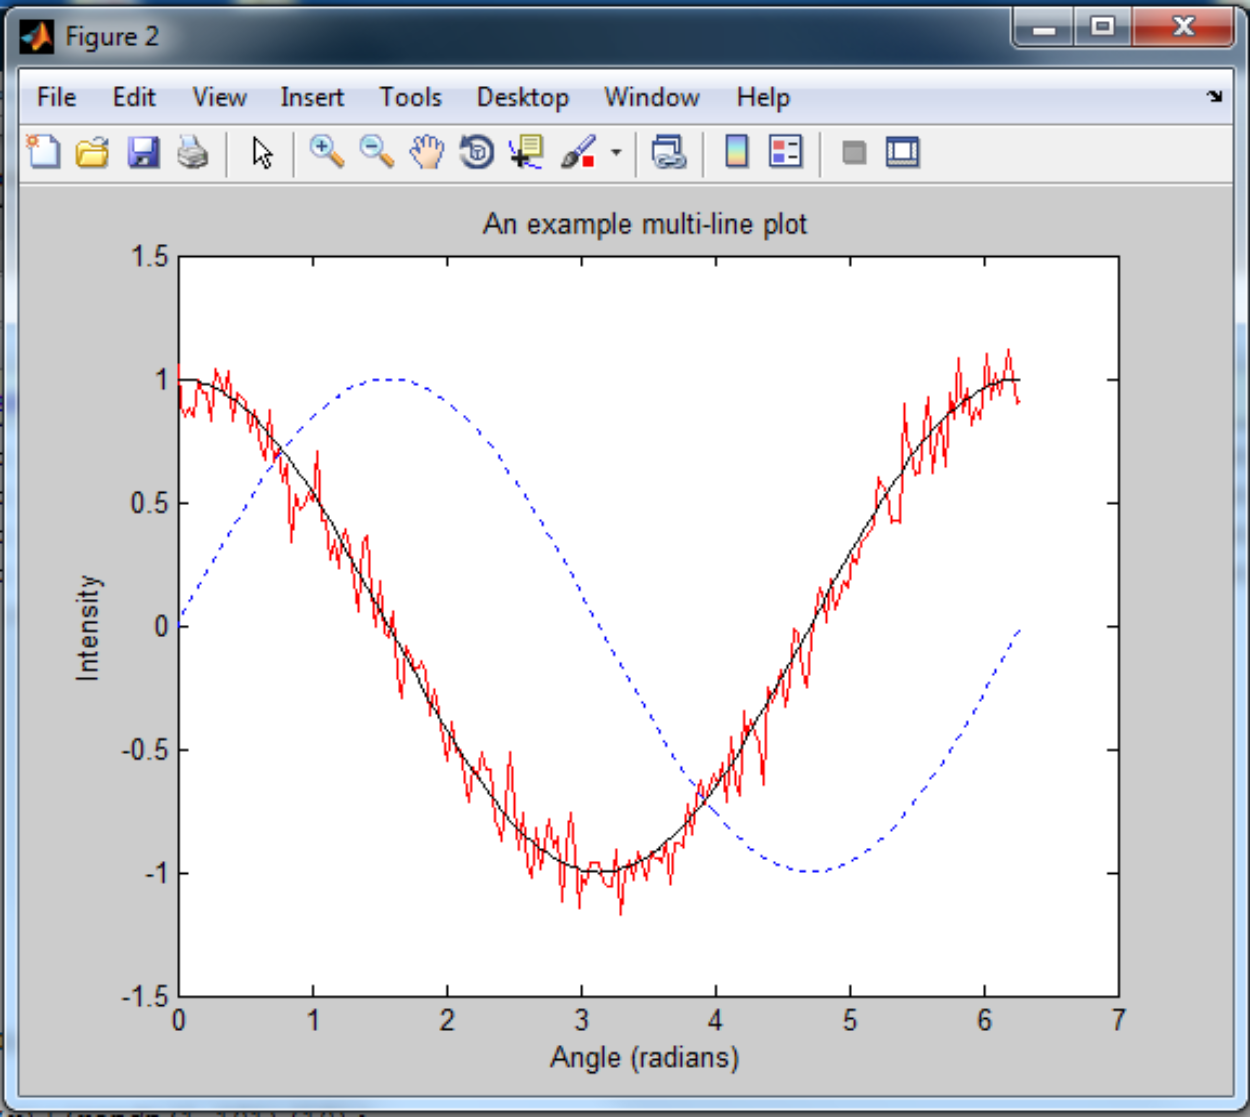
Let's now add some annotations (labels) to the plot to make it more self descriptive.
We can add titles as well as label the two axis:
[matlab]
title('An example multi-line plot')
xlabel('Angle (radians)')
ylabel('Intensity')
[/matlab]
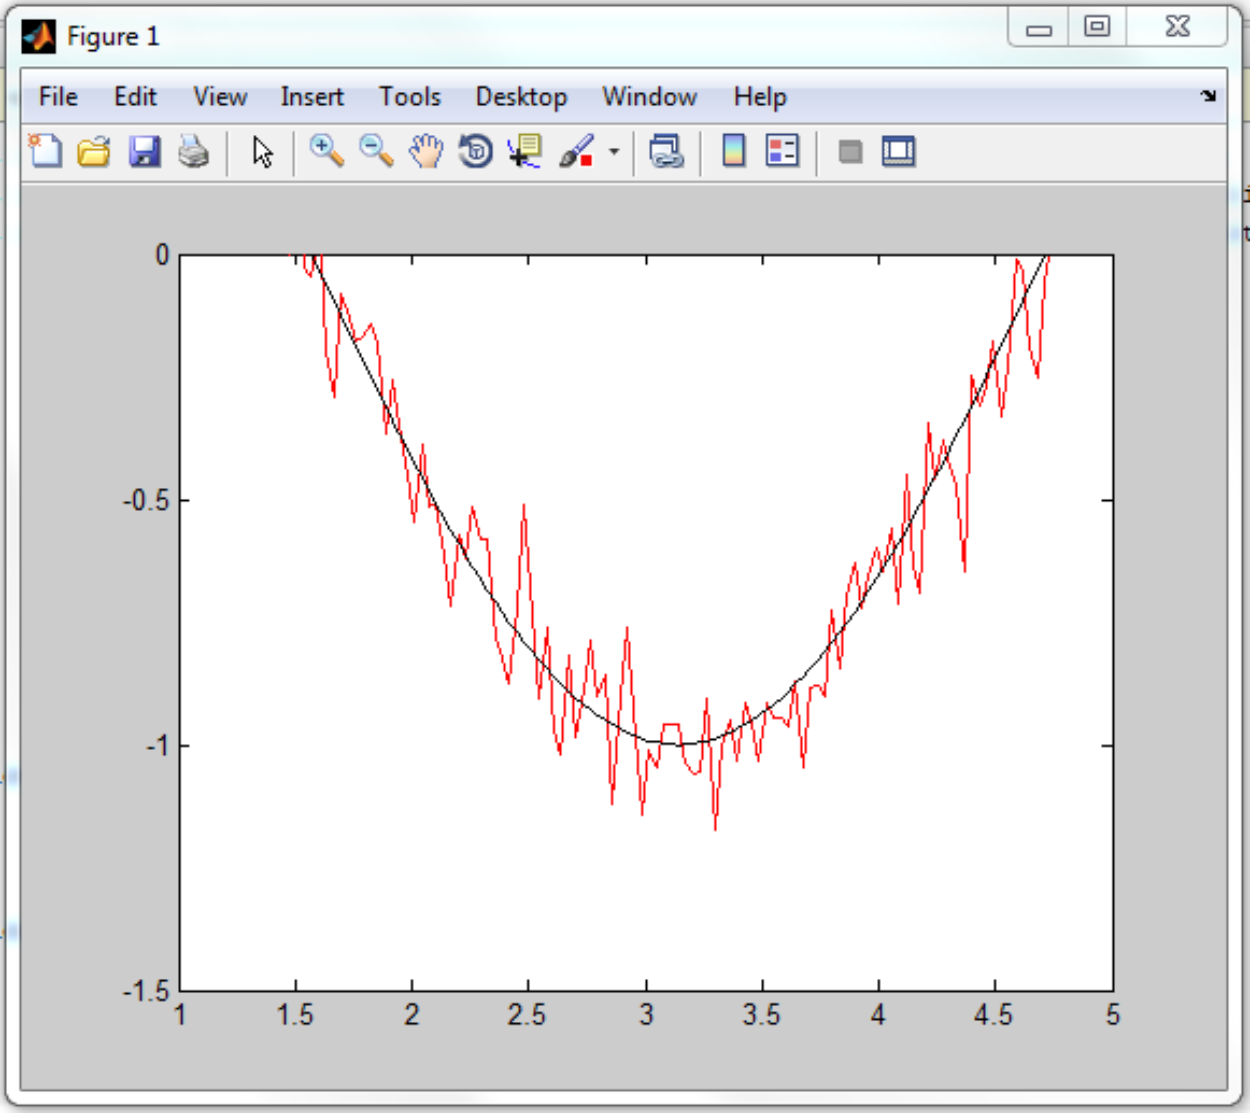
We can also change the extent of the plot (the range in values that the x and y axes cover) using the "axis" command.
[matlab]
axis([1 5 -1.5 0]) % xmin xmax ymin ymax
[/matlab]