12.5) Sub-Plots
It is possible to have multiple plots within one figure. Using "subplot", plots are placed on a grid within the figure window.
To divide the figure into an m x n grid and specify position p, the syntax is subplot(m,n,p). For example:
[matlab]
x=[0:10]
y1=sin(x);
y2=cos(x);
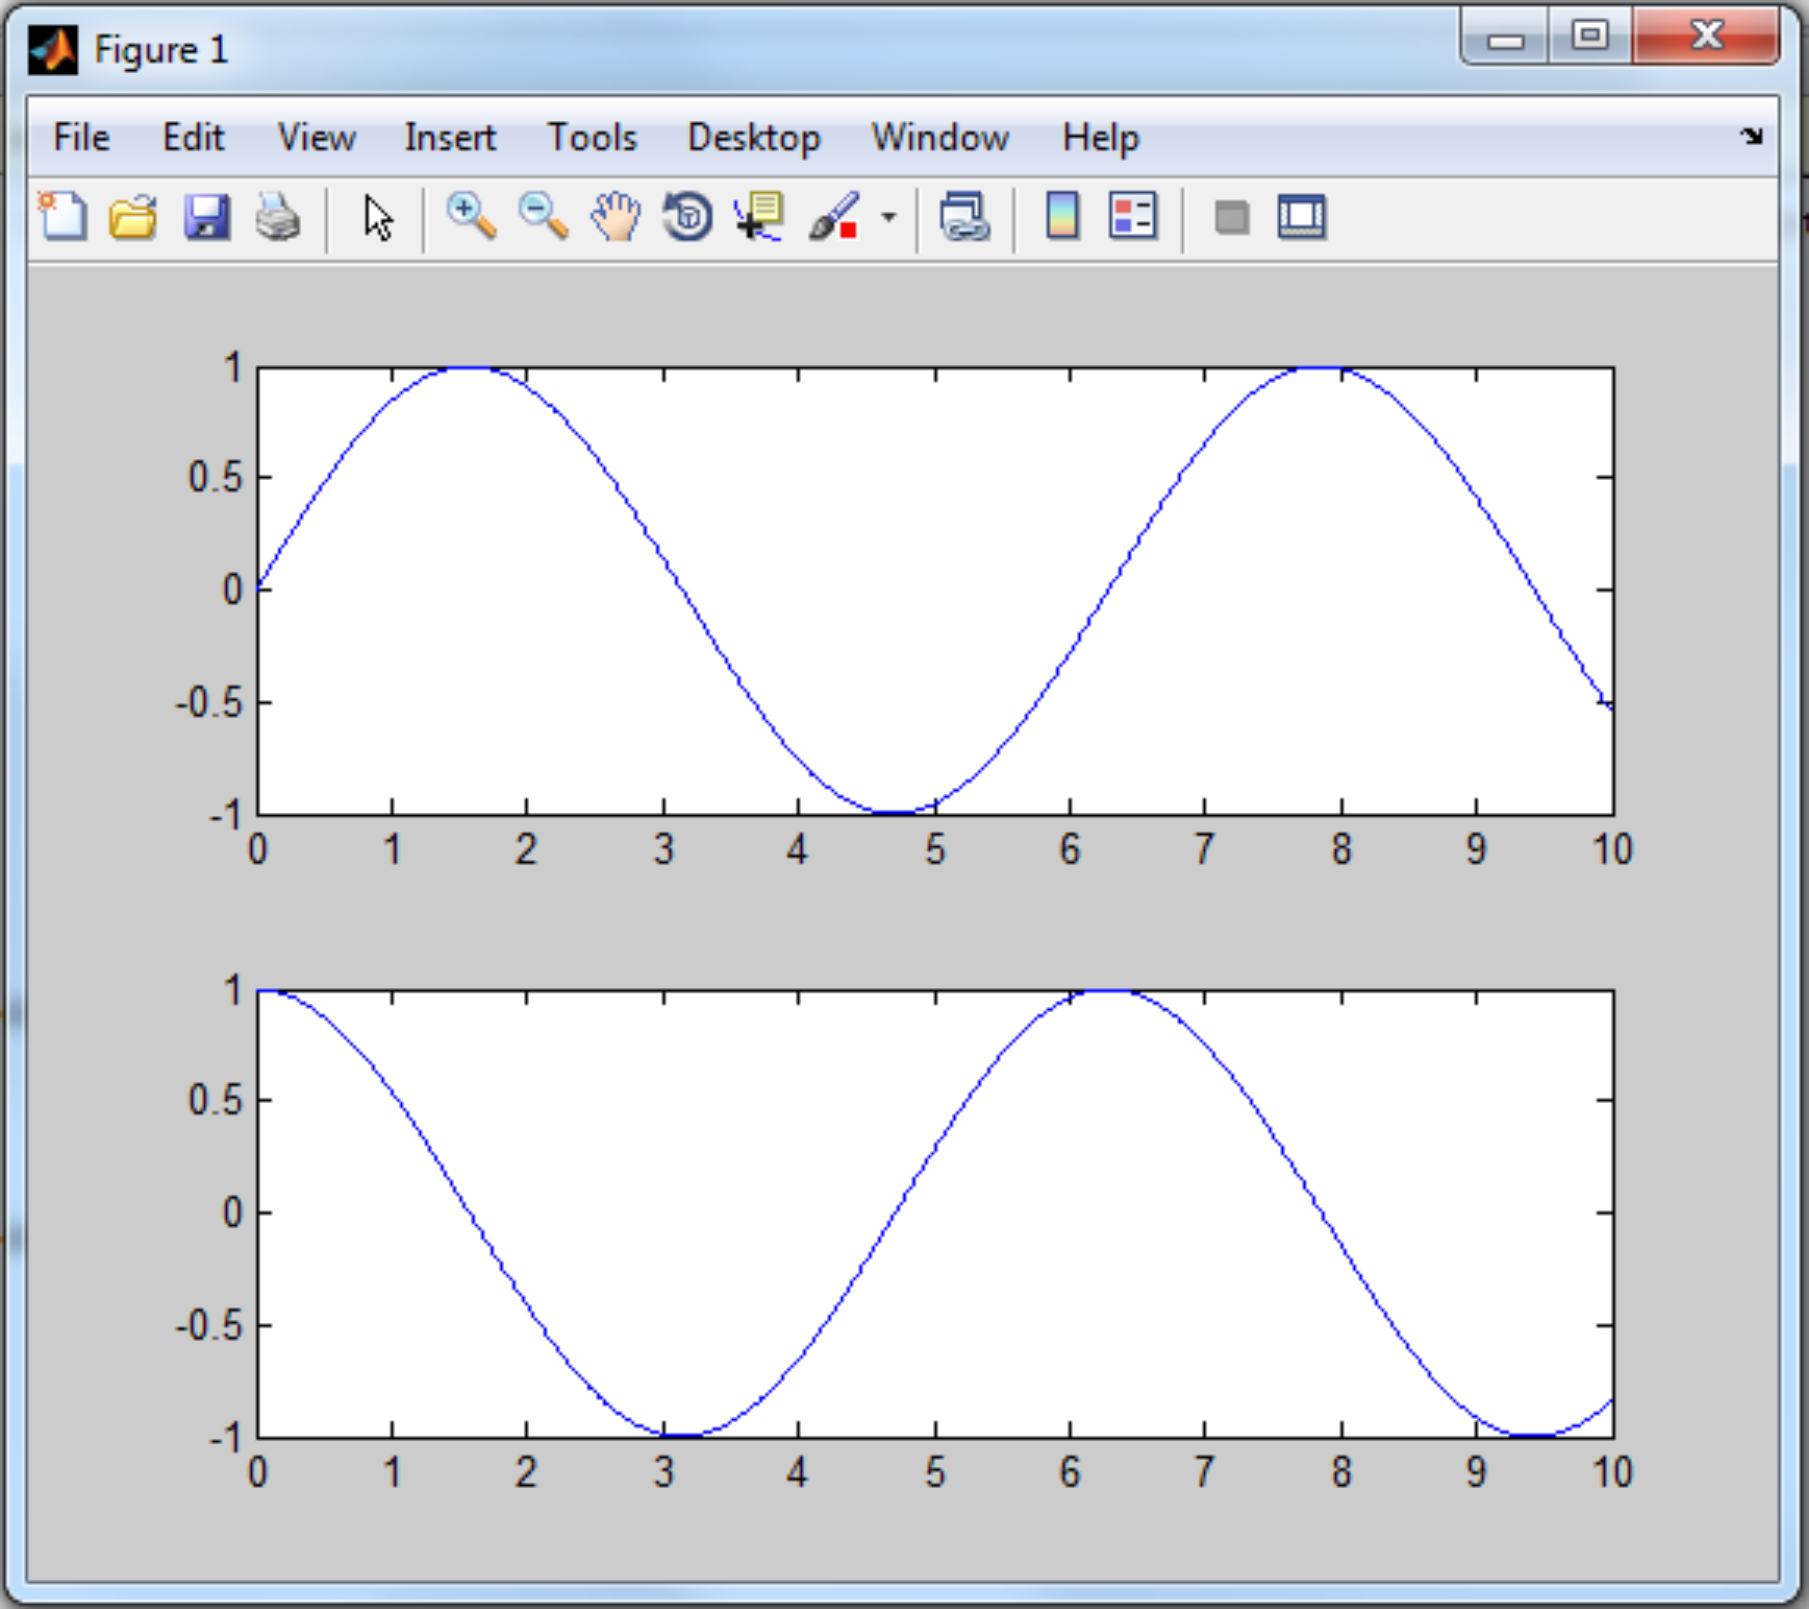
subplot(2, 1, 1)
plot(x, y1);
subplot(2, 1, 2);
plot(x, y2);
[/matlab]