9.4) Monitoring
Now we need to determined what we need to change in the model to quantitatively observe the speed and extent of the PV adoption. One of the advantages of using an ABM specific platform like NetLogo is, that there are lot of different tools to observe our models. We used some of them already extensively, for example the View is an excellent tool to “visually” debug a model. Equally useful are the agent monitor, print out statements and the command centre. The once we are going to use now are plots and monitors, in the interface.
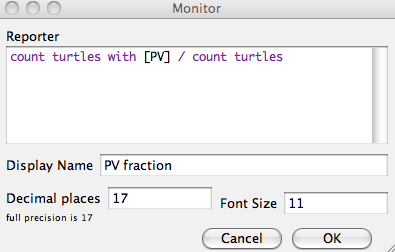
To monitor the fraction of houses with a PV installation we use a monitor.
Go to the interface and select monitor from the drop down menu, insert one, and name it (Display name) PV fraction. In the reporter we can directly write our code. NetLogo allows us to directly code in the monitor and plotting fields, instead of creating and calculating an additional variable. We basically want to count all turtles PV installations and divide them by all turtles, therefore type count turtles with [PV] / count turtles in the reporter field.