15.2) Your First Plot
First things first, import the matplotlib package. You’ll need the submodule pyplot. To avoid typing matplotlib.pyplot before every function, use an alias. Type the following in IDLE:
>>> import matplotlib.pyplot as plt
Now the simplest kind of plot is when you have a vector of values in a list or array:
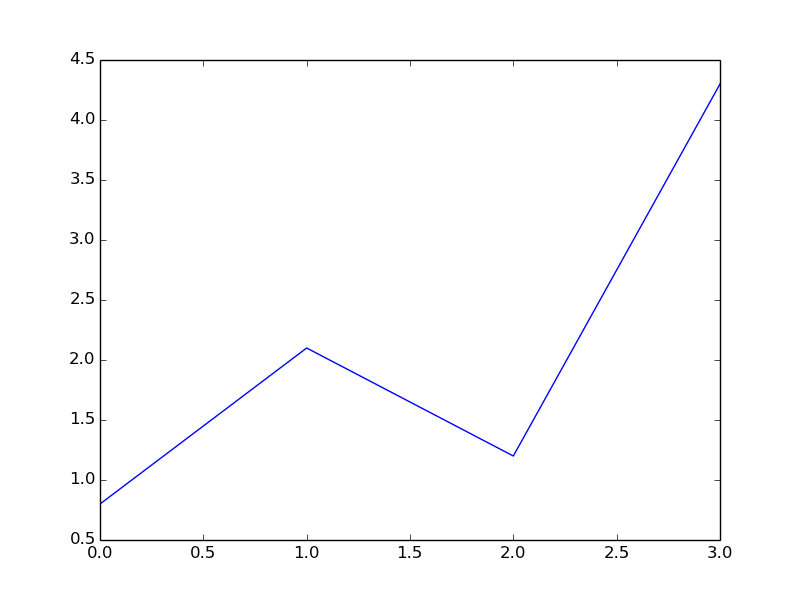
>>> plt.plot([0.8, 2.1, 1.2, 4.3])    # create the plot
>>> plt.show()     # show the plot
If you do this in IDLE interactively, you’ll have to close plot and start again if you want to add labels or change anything in the plot. So we’ll change tactic and write a program to produce our plot. That way we can easily modify it to add labels, change colours... Later we’ll learn a way to create plots interactively.
Create and save a file with the following code:
import matplotlib.pyplot as plt
plt.plot([0.8, 2.1, 1.2, 4.3])    # create the plot
plt.show()                  # show the plot
Run your program.