15.3) Labels And Axes
Let’s add some labels and control on the axes limits:
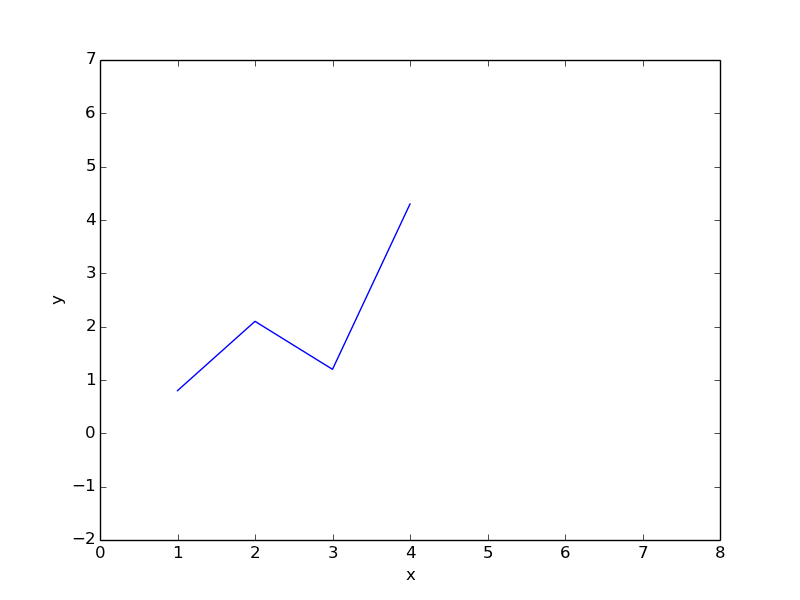
import matplotlib.pyplot as plt
x=[1,2,3,4]
y=[0.8, 2.1, 1.2, 4.3]
xmin=0
xmax=8
ymin=-2
ymax=7
plt.plot(x,y)    # create the plot
plt.axis([xmin,xmax,ymin,ymax])
plt.xlabel('x')
plt.ylabel('y')
plt.show()       # show the plot
Notice this time we are providing two vectors or coordinates x and y. If you only provide y, it produces a x vector which is essentially:
x=range(len(y))