15.4) Lines And Markers
Now we can change the looks of the line and markers. In your program, replace the plot line with this one:
plt.plot(x,y,
         linestyle='--', linewidth=5.0, color='r',
         marker='^', markersize=20.0,
         markeredgewidth=2.0)    # create the plot
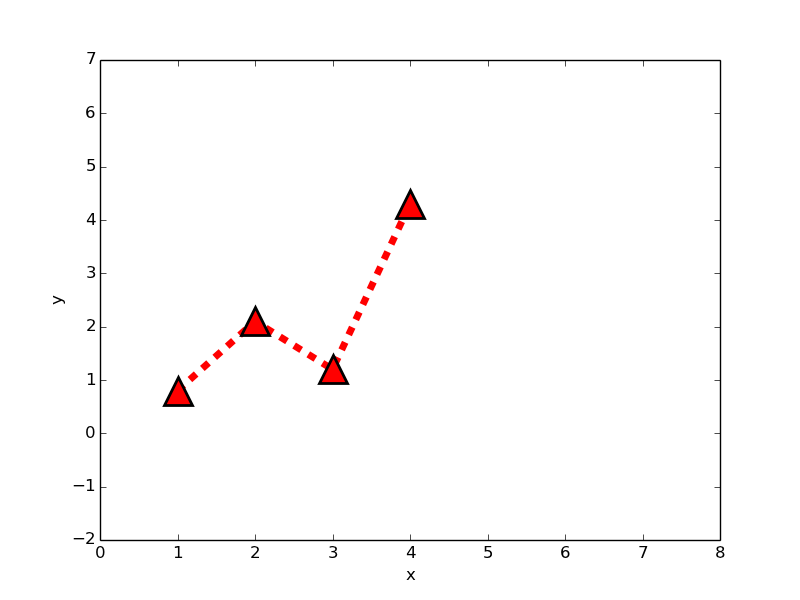
Alternatively, you can put all of the line and marker characteristics in one string:
plt.plot(x,y,'r--^')
This will produce a red (r) dashed line (--) with a triangular markers(^).
Now let's see the range of line styles and markers you can use.