4.7) Useful Functions To Summarize Data
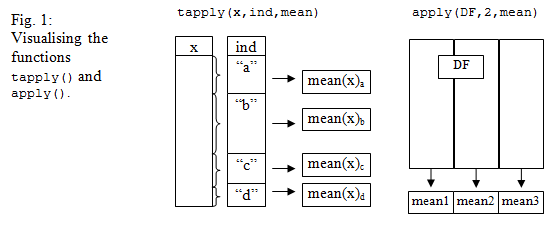
These all take some careful thought to understand. Drawing your own diagram (e.g. Fig. 1) may help!
tapply() |
This groups a numeric vector according to the values of a factor and calculates a summary statistic of your choice for each level of the factor. So it takes three arguments – e.g. tapply(GRASS$Tlrs, GRASS$Group, mean). The first is the numeric vector, then the factor, then the name of the summary function (as the help file will tell you!). |
apply() |
This goes through a matrix or array and calculates a specified function for each row (if MAR=1) or each column (if MAR=2). See also ?colSums for a simpler version. |
reorder() |
This reorders a factor according to the mean value of an equal-length quantitative vector (X=) at each level of the factor. So it’s like an extension of tapply() that uses summary values to reorder the factor – e.g. reorder(MADEUP$group, X=MADEUP$y). Another function instead of the mean can be specified using the argument FUN= (e.g. FUN=median). |