4.5) Exponential Growth: GDP
The chart below shows GDP growth for the USA from 1990 to 2000 (and the constituent parts of the production function). It is taken from Ayres and Warr (2002).
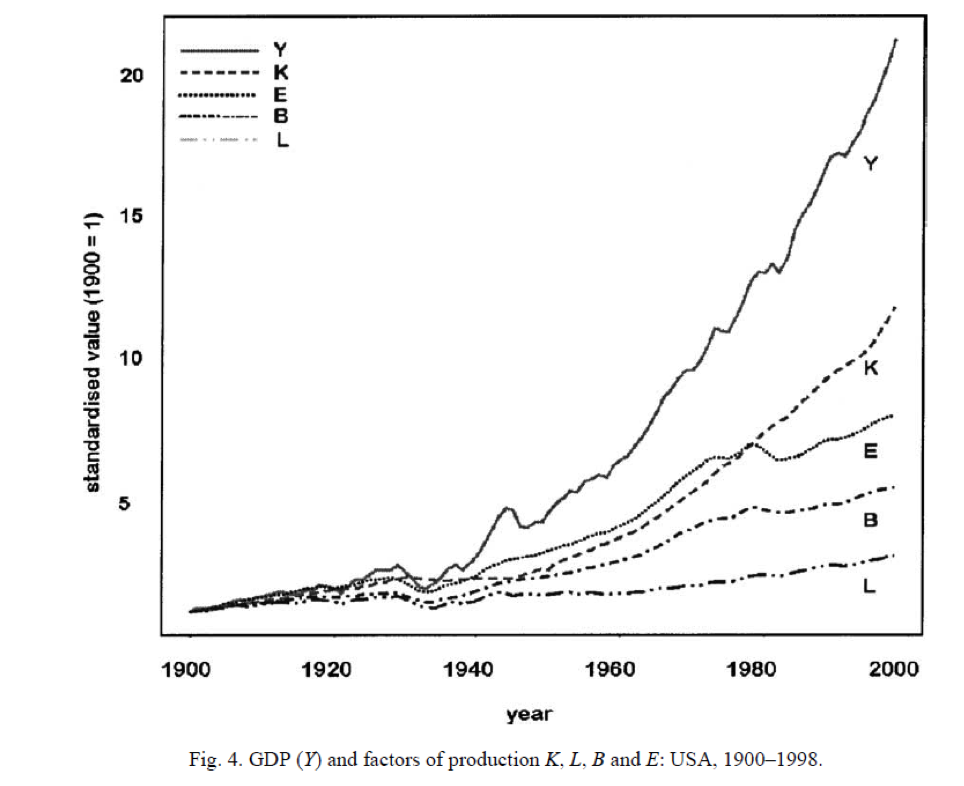
(Source: Ayres, R.U.; Ayres, L.W.; and Warr, B. "Energy, Power and Work in the US Economy, 1900-1998", Energy 28 (3): 219-273")