8.5) Results
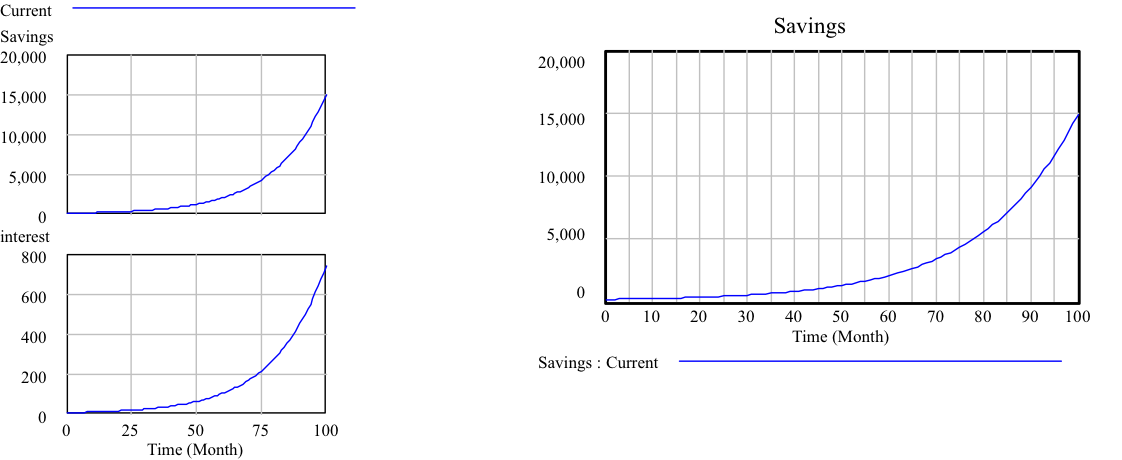
Use the “Move/Size” sketch tool to select the “Savings” variable, then click on the “Causes Strip” button and the “Graph” button in the analysis toolbar to bring up plots of the “Savings” and “interest” variables:
Use the “Move/Size” sketch tool to select the “Savings” variable, then click on the “Causes Strip” button and the “Graph” button in the analysis toolbar to bring up plots of the “Savings” and “interest” variables: