8.6) Sensitivity Analyses
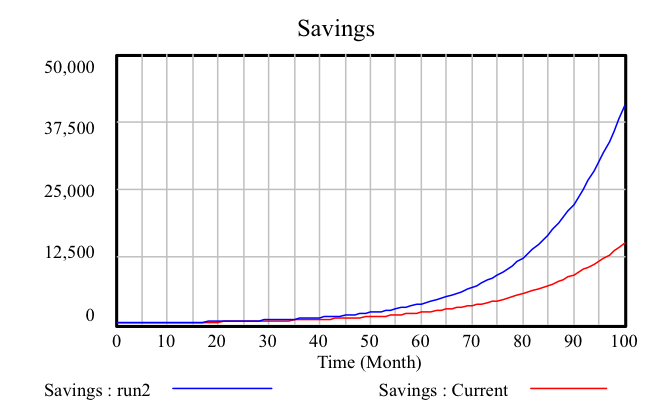
- Vensim will also allow you to run sensitivity analyses and compare results. Click on the “Sim Setup” button in the main toolbar. Immediately to the right of this button, you can now enter the name of this simulation run, call it “run2”. The “interest” variable will also be highlighted to indicate that you can change its value. To do this, click on the variable to bring up a text box into which you can type a new value, make it “0.06”. Press “Enter” and then click on the “Simulate” button in the main toolbar again. Clicking on the “Graph” button in the analysis toolbar will now display the results of both simulation runs:
- The “Control Panel” button in the main toolbar will bring up a window that allows you to choose which simulation runs to include in graphs